Tuesday 14 September 2021

Market Overview for the First 8 months of 2021 in Oxford County.


Oxford County:

Active & New Listings continue to decline since the peak in May at 328 new listings coming to market. In July only 239 homes were listed. In august this number dropped to 198 new listing across the entire County. When added to the few remaining previously listed homes supplies remain limited. The number of homes offered for sale dropped further under the current 2 months, supply level. Remember a balanced market, where bidding wars don’t take place, is 6 months’ supply!


The bidding wars are continuing. In February Homeowners the highest level of bidding wars occurred with the listing price to selling price ratio averaging over 11% above asking prices. Since then, the level of bidding wars prices has been steadily dropping. Usually, June is the top selling month of the year. The average price for June was 4.9% above asking prices. The average selling price to listing price in July, fell to 4.1% above asking prices. It has started to climb again due to further reduction of inventory in August to the lowest level since March. This will cause prices to climb again as we enter the Fall selling period. Remember in January we started the year with 92 homes sold across the County. We peaked in May with sales of 267 homes selling. June was quieter, as detailed above, with sales of only 222 home, falling again in July to 201 homes sold and finishing the Summer months with only 195 sales in August.


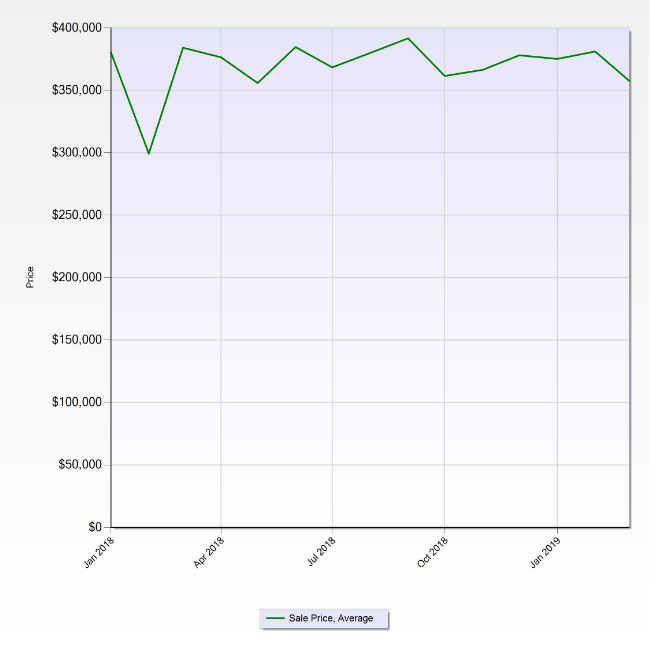
Inventories of available properties remain unusually tight, however, even with constant bidding wars occurring the average selling prices have been sitting around the $635,000 mark.  The average selling price peaked in June, across the County, at $649,211, falling during July to $609,131. The prices have started to rebound in august to $633,055. The average number of days it takes to sell a home has risen from a low in April and May of 10 days, to 12 days in June, 15 days in July and 16 days for the month of August.


The reason the Listing Price to Selling Price ratio is declining is the result of some Homeowners trying to push the market by listing at a top selling price for a specific size and feature of a home and are therefore not receiving bidding wars and usually end up selling 2% to 3% below listing price.  Homes priced below market, say at $599,900, about $50K to $75K below value are getting massive bids and often do better than a market priced home. Buyers from out of town, with an out-of-town Realtor, are looking at Realtor.ca and can only see competing homes for sale. Out of Town Realtors cannot see what homes are actually selling for.


Summary:

The London Area which includes Oxford County in terms of Pricing is offering the 4th lowest priced market of the 12 major markets monitored across Canada.


Always remember, I am here to help in any way that I can be of service to you and your family.


First, I have a message for First Time Home Buyers. In this crazy on-going Covid Market, you may need Family support for the down payment to help you bid what appears to be 10% to 15% over the asking price or look for a real fixer upper with good potential.  The first step is to get pre-qualified by a Mortgage Broker or your Bank. Once you find out what you can reasonably afford, plan to bid above the asking price as described above with a Cash, Non-Conditional Offer with a short closing if you are renting.  With the average price still rising, you will logically be able to pay back Mom and Dad within 24 months.  Sweat equity in a fixer upper can yield big dividends. As your Realtor, I will investigate market values in your planned neighbourhood and provide comparable sales.


Now for you Move-Up Buyers, now is the best time to use some of that equity that you have built up over the last year. The first step is to get pre-qualified by your existing mortgage holder and outline how your new mortgage will be blended without penalty. Once you find out what you can reasonably afford, I will evaluate the Market Value of your home and outline all contingencies at no cost to you. This will give you the ability to safely overbid the asking price with a Cash Non-Conditional Offer and a closing of 2 to 3 months. If priced reasonably, you can expect the same over-bidding that you are making. Your equity will cover the excess price on Closing.  With the average home selling within 2 weeks, the risk is virtually non-existent.


Lastly, if you do not have to sell, this is the worst time to do so! Every day that passes brings increased equity to our current homeowners.


I am here ready to assist!


Do not wait, pick up the phone, or email and I will be at your side, looking after the best interests of You and Your Family!


Just Call:

Cell- 519-535-3975

Home Office- 548-688-8833

Email- gib@youtfavouriterealtors.com


MLS connected Website – http://OxfordProperties.ca


Monday 3 May 2021

Market update for the First Quarter of 2021 Plus Overview of April 2021 in Oxford County.


Oxford County:

In January there were only 320 new listings, February 319, March only 385 and April 475 homes came to Market. When added to the few remaining previously listed homes supplies remain limited. The number of homes available for sale, dropped from a high in January of 3 months’ supply for the slowest selling time of the year to about 1 ¾ months’ supply in February and dropped again in March to only 1 month’s supply.  April rebounded marginally back to 1 ¾ months’ supply.  Remember a balanced market is 6 months’ supply!

You can imagine the bidding wars that are occurring as a result. In January homeowners averaged 10% of asking. This means most were in Bidding Wars.  In February as months’ supply dropped, Homeowners averaged 109.6% of asking prices. In March this rose to 110% of asking prices and leveled off a bit with the larger number of homes coming to Market in April at 108.5% of asking prices.

Let us look at sales across Oxford County. In January we started the year with 128 homes sold across the County. In February, this number increased to 222 homes sold, in March this jumped to 342 homes sold and finally in April at 344 homes sold.

With this unusually tight inventory of homes available, what did this do to prices?  In December, we finished the year with a record of $529,551 for the average home across Oxford County.  January showed a significant jump of 16.6% to $617,365. In February, a further jump in value to $622,936, March delivered another value increase to $632,283 and we finished April with a final overall monthly increase in the first 4 months of 2021 of 27.8% delivering a new average price for the month of $676,504.


Woodstock:

In January there were 26 new listings on homes offered for sale, February 32 homes, March 47 homes. Finally in April 86 homes came to Market. When added to the few remaining, previously listed homes, inventories of available homes remain limited. Supplies dropped from a high in January of 60% of 1 month’s supply for the slowest selling time of the year, to about 1/2 month’s supply in February and March.  April rebounded marginally back to 80% of a single month’s supply.  Remember a balanced market is 6 months’ supply!


You can imagine the bidding wars that are occurring as a result. In January Homeowners averaged 2.1% above asking price. This means most sales involved Bidding Wars.  In February as months’ supply dropped, Homeowners averaged 114.7% of asking prices. In March this dropped marginally to 108.7% of asking prices and stayed at this level, even with a larger number of homes coming to Market in April finishing at 108.2% of asking price. In March and April, it took only an average of 8 days to sell a home in Woodstock.


Let us look at sales across the City. In January we started the year with 35 homes sold in the City. In February, this number increased to 70 homes sold, in March this jumped to 105 homes sold and finally in April things leveled marginally to 97 homes sold.


With this unusually tight inventory of homes available, what did this do to prices?  In December, we finished the year with a record of $539,604 above the average home across Oxford County.  January showed a jump of 10.3% to $595,379. In February, a further jump in value to $630,727, March delivered another value increase to $632,283 and we finished April with a final average increase for the first 4 months of 2021 of 16.6% delivering a new average price for the month of $629,253.


Ingersoll:

In January there were 25 new listings, February 20 listings, March 15 listings and finally in April only 19 homes came to Market. When added to the few remaining previously listed homes, the inventories of available homes remain limited. Supplies dropped from a high in January of 3 1/2 months’ supply for the slowest selling time of the year, to about ¾ of month’s supply in February, and in March and April the number of available homes dropped to about ½ of a single month’s supply.  Remember a balanced market is 6 months’ supply!


You can imagine the bidding wars that are occurring as a result. In January homeowners averaged 1.5% above asking price. This means most sales involved Bidding Wars.  In February as months’ supply dropped, Homeowners averaged 120 % of asking prices. In March this dropped marginally to 118.8% of asking prices and in April fell marginally to 116.3 % of asking prices. In March it took 21 days to sell a home and by April it took only an average of 11 days to sell.


Let us look at sales in Ingersoll. In January we started the year with 7 homes sold across Municipality. In February, this number increased to 25 homes sold, in March this number of homes sold rose to an average 38 for the months of March and April.


With this continuing tight inventory of homes available, what did this do to prices?  In December, we finished the year with a record here, as well, of $540,876, (based only on 9 homes sold) which was also above the average home across Oxford County and Woodstock.  January showed a jump of 24.5% to $673,414 (based on only 7 homes sold). In February, a drop in average value to $555,184, March delivered a solid value increase to $587,615 and we finished April delivered an overall increase after the first 4 months of 2021 of 16.6% when compared to December of 2020, delivering a new average price for the month of $601,280 for the Municipality.


Norwich Township:

In January there were 14 new listings, February 10 listings, March 12 listings and finally in April only 11 homes came to Market. Wadded to the few remaining previously listed homes the inventories of available homes remain limited. Because of only a limited number of sales in this area, January came in at 80% of a single month’s supply (for the slowest selling time of the year). In the month of February, though to the end of April, the number of available homes dropped further to what is defined as almost “0%“ of active inventory.  Remember a balanced market is 6 months’ supply!


In January homeowners averaged 97.4 % of asking price. With few Bidding Wars.  In February as months’ supply dropped almost 50 %, Homeowners averaged 100 % of asking prices bringing on the Bidding Wars. In March this competitive activity increased to 105.3 % of asking prices and in April it fell marginally to 100.7 % of asking prices. In March and April, it took only an average of 15 days to sell the average home.


Let us look at sales across the Township. In January we started the year with 11 homes sold across Township. In February, this number increased to 20 homes sold, in March this number of homes sales rose to 18.  In April, this number settled at 16 homes sold.


With this continuing tight inventory of homes available, what did this do to prices?  In December, we finished the year with a record here, as well, of $624,361, also above the average home sale price across Oxford County and Woodstock.  January showed a jump of 24.5% to $770,727. In February, we saw a drop in average value to $699,460, March delivered a solid value increase to $744,939 and we finished April with an overall increase finishing the first 4 months, month by month, of 2021 of 102.7%, delivering a new average price for the month of April of $641,197 for the Township. The sales in February and March when added to the 12-month average will push the average increase up significantly.


Summary:

Always remember, I am here to help in any way that I can be of service to you and your family.


First, I have a message for First Time Home Buyers. In this crazy on-going Covid Market, you may need Family support for the down payment to help you bid 10% to 15% over the asking price.  The first step is to get pre-qualified by a Mortgage Broker or your Bank and try for a open mortgage. Once you find out what you can reasonably afford, plan to bid above the asking price as described above with a Cash, Non-Conditional Offer with a short closing if you are renting.  With the average price running up +20% you will be able to pay back Mom and Dad within 12 months.  As your Realtor, I will investigate market values in your planned neighbourhood and provide comparable sales.

Now for you Move-Up Buyers, now is the best time to use some of that equity that you have built up over the last year. The first step is to get pre-qualified by your existing mortgage holder and outline how your new mortgage will be blended without penalty. Once you find out what you can reasonably afford, I will evaluate the Market Value of your home and outline all contingencies at no cost to you. This will give you the ability to safely overbid the asking price with a Cash Non-Conditional Offer and a closing of 2 to 3 months. If priced reasonably, you can expect the same over-bidding that you are making. Your equity will cover the excess price on Closing.  With the average home selling within 2 weeks, the risk is virtually non-existent.

Lastly, if you do not have to sell, this is the worst time to do so! Every day that passes brings increased equity to our current homeowners.

I am here ready to assist!

Do not wait, pick up the phone, or email and I will be at your side, looking after the best interests of You and Your Family!


Just Call:

Cell- 519-535-3975

Home Office- 548-688-8833

Email- gib@youtfavouriterealtors.com


MLS connected Websitehttps://OxfordProperties.ca

Thursday 17 September 2020

CORONA JUNE, JULY & AUGUST UPDATE FOR OXFORD COUNTY


Sales are almost back to normal across the County.  Controlled Open Houses are now back, with only 1 couple at a time (in a touch free environment).

The market is also rebounding.   In June we hit 96.4% of the record sales in June 2019.  (216 sales versus 224 a year ago across the county).  In July, sales set a record by matching the 216  homes sold in June 2020.  This represents an increase of 29% over July 2019. In August, the number of homes sold returned to normal levels, selling 108 homes across the County compared to 107 in 2019. Leading up to these June and July homes sold across the County, sales were at normal sales levels until “mid” March:

January:        140

February:      141

March:          162     +14.9%


As per our last report April and May home sales were terribly slow:

April:           102

May:            125


And now June, July& August:

June            184

July             209     +29%

August        108


Let us Look at Prices:

Prices peaked across the County in March at $481,301 and then dropped to $416,919 in April, rebounded in May to $486,613 and leveled out in June at $480,054 and rose back to $486,326 and breaking the $500,000 barrier in August to $505,839.

What does the future look like… Inventory of home available across the County will tell the full story!  Prices will recover quickly and rise above the $505,839 peak experienced in August 2020.

The number of homes available for sale this time of year are well below 2019. This puts significant upward pressure on prices.  May's number of homes for sale translated in to 4 months' supply. June dropped to 3 months' supply and July & August dropped further to only 2 months' supply of homes for sale. Technically we are back into a Very Hot SELLER'S Market with bidding wars in virtually all pricing Categories. The most aggressive over bidding isn the $250,000 to $500,000 price categories averaging out above 6% over asking. What that means is you may see bids between 15% and 29% over the list price.

The number of homes available for sale is driving this pricing.  Available homes for sale sit well below last year's crazy market. May's number of homes offered for sale translated into only 4 months of supply (a balanced market is 6 months of supply). Then June's supply dropped to 3 months and now July and August dropped further to only 2 months of inventory based on current demand by Buyers. the most aggressive price categories are between $250,000 and below $550,000 averaging above +6% above asking prices. This means you must come up with the cash for any bid above a home priced to current market.  Banks  used Current Market Valuations for loans.  This could mean that a family with 25% down, could be forced into Canada Mortgage  & Housing Corporation Insurance program because they chose to overbid by 15% to 20%

Remember, Buyers overbid because they believe that prices are going to continue to rise and the price that they are forced to pay now will be offset with a year to two at the latest.

If you know someone:

Who “needs to sell” due to their financial situation?

Who “needs a larger home” for their growing family?

Is a first-time buyer who is “ready to buy their first home”?


Call us with their name and contact information today. 

Do not wait! They will be paying a lot more if they do!


Put our 18 years of Award Winning Real Estate Service to work!

You'll be glad you did!


Gib & Mary Heggtveit

Broker & Sales Representative

RE/MAX Centre City Realty Inc.


Gib Cell:        519-535-3975

Mary Cell:     519-535-7355


Email:            gib@yourfavouriterealtors.com


Monday 10 August 2020

CORONA JUNE & JULY UPDATE FOR OXFORD COUNTY


Sales are almost back to normal across the County.  Controlled Open Houses are now back, with only 1 couple at a time (in a touch free environment).


The market is also rebounding.   In June we hit 96.4% of the record sales in June 2019.  (216 sales versus 224 a year ago across the county).  In July, sales set a record by matching the 216  homes sold in June 2020.  This represents an increase of 29% over July 2019. Leading up to these June and July homes sold across the County, sales were at normal sales levels until “mid” March:

January:        140

February:     141

March:          162     +14.9%

As per our last report April and May home sales were terribly slow:

April:              102

May:              125

And now June and July:

June               184

July                 209     +29%


Let us Look at Prices:

Prices peaked across the County in March at $463,677 and then dropped to $398,658 in April, rebounded in May to $475,362 and leveled out in June at $470,748 and rose a further 1.5% to the highest average monthly selling price at $477,751 for the year.


What does the future look like… Inventory of home available across the County will tell the full story!  Prices will recover quickly and rise above the $477,751 peak experienced in July 2020

The number of homes available for sale this year are well below 2019. That puts significant upward pressure on prices. May's number of homes for sale translated into 4 months supply of homes offered for sale based on demand. June dropped to 3 months supply and then dropped further in the month of July to only 2 months supply of homes for sale. 

Technically we are back into a very aggressive bidding marketplace with bidding going on every offer to purchase in all price categories.  The most aggressive bidding is taking place on homes offered for sale across the County between $300,000 and $400,000.


If you know someone

who "needs to sell" due to their financial situation

someone who "needs a larger home" for their growing family 

A First-Time Buyer who is ready to buy


DO NOT WAIT!  They will be paying a lot more.


Call us now with their name and contact information.


Put our 18 years of Award- Winning Real Estate Service to work for them, you'll be glad you did!

Gib & Mary Heggtveit

Broker & Sales Representative

RE/MAX Centre City Realty Inc.


Gib Cell:         519-535-3975

Mary Cell:     519-535-7355


Email:             gib@yourfavouriterealtors.com

Wednesday 17 April 2019

Oxford County: Woodstock, Ingersoll and Norwich Township Market Update for 2019


Oxford County:
Last year, in the first quarter of 2018 Sales fell over 30% following the record year of 2017.  The number of homes available for sale in 2018 decreased as well pushing price up.  This year, in 2019 Sales of homes in the First Quarter increased marginally by +1.7%. Sales leveled off in March falling -8.8% following 2 strong months +7.3% in January and +12% in February. Below is a chart showing the number of homes sold by price category.  The strongest category in Oxford County is the $300,000 to $350,000 price range selling 77 homes in 3 months.


The number days that it took to sell the average home started the year at 55 days. Obviously, this time period would be much shorter for the homes in the $300,000 to $450 price range and longer for the rest as you can see above.  The number of days to sell dropped to 50 days in February and 39 days in March.  Why does it seem to be a longer time to sell?  Active listings are up 18.4% for the first quarter.  This increase has been consistent in each month so far ranging between 18.1% for January and February and 18.9% for March. This translates to 4 months’ supply of homes in January increasing to 5 months’ supply in February and dropping down to 4 months’ supply for March because of +12% higher sales in February.


Home owners as a result are getting an average of 99% of asking price.  Below is a chart that reflects the percentage each group of home owners are getting by price group across the County. Strongest categories are $200,000 to $400,00
Woodstock:
Last year the number of homes sold in the first 3 months fell more than 30% following the record sales in 2017 for the year.  In the first 3 months of 2019 the number homes that sold in Woodstock fell by 9.7%. This decrease was during the month of March 2019.  Up until then, the sales of January and February were the same as 2018.   At the same time, the number of homes available of sales have been climbing. This number is 1.3% above the number of homes available last year.  This puts upward pressure on months’ supply of home available for purchase.  Currently we have been consistently running at an average of 4 months’ supply each month.  As we move into the warmer weather and head for the peak in June sales naturally increase dramatically.  The key now is the average number of days that it takes to sell the average home.  In January and February this time frame sat at an average of 50 days.  In March sales almost double over January and February.  As a result, the number of days to sell the average home dropped to only 28 days on average with home owners getting 99% of asking price. Please refer to the graph under Oxford County to see how this breaks out by price range.
As a result of this upward pressure on number of homes offered for sale and sales down over last year for the first 3 months, prices are holding flat up only $222.00 at $370,199 over last year’s average selling price. 
Once again, the number of homes coming to market is the key.  Sales now are typically much stronger. We are still confident that we will see a 5% to 8% increase for this year.  Please refer to the comments regarding CMHC in the Oxford County Section above.

Ingersoll:
The number of homes sold in Ingersoll is up dramatically for the first 3 months of 2019.  Setting the lead in County.  At the end of March after 3 months the number of homes sold is up +48.3%. Sales were +66.7% in January and +72.7% in February and continued into March softening a bit to +20%.  The number of homes offered for sale also climbed dramatically by 82.9% for this 3-month period in 2019 versus a year ago. The number of days to sell the average house sat at 53 days in January then dropped to 25 days in February and dropped again in March 2019 to only 21 days.  The sales of homes and the number of homes available currently sits at 3 months’ supply down from 4 in February. The average home as a result received 100% of their asking price in Ingersoll during the first 3 months of 2019.  Refer to the graph under the Oxford county for a typical listing price to selling price percentage based on price categories. This graph holds true for the entire area.
As a result of these sales increases, price have risen nicely here.  The activity in this market combined with only 3 months supply of homes in both January and March have moved the average home in Ingersoll to within $9,968, or a difference of only +2.6% when compared to the average home price in Woodstock. It used to run at +10% to +15%. The average price increase for a home sold in Ingersoll year to date is up +7.8% or $26,119 over the average for the 12-month period ending December 31, 2018. An amazing result when you consider Woodstock increased only $222 over the last 12-month period.

Based on the 3-month supply of homes offered for sale in this area it is logical that prices will continue to rise and hold over the months ahead. The average price in this area like Woodstock is well within the target range of the new CMHC proposed First Time Buyer support program.

Norwich Township:
The number of homes sold for 3 months is not significant in this area.  For example, so far this year there have been only 21 sales, down from 26 sales in the same 3-month period last year. This translates into a decrease of -19.2% for the 3 months of 2019.  March sales dropped -50% from 10 homes sold last year to 5 homes sold this year impacting the first quarter.  As time passes and the number of sales increases this will be more meaningful. The number of homes available for sale also fell during the first 3 months of 2019 by 6.8%. During March there were 47 homes offered for sale across Norwich Township. Typically, the average home owner was getting 99.5% or better of their asking price in both January and February.  This fell dramatically in March to 96.6% due to the decline in demand during the month across Oxford County.  Putting the March number aside and looking at January and February results only, average days it takes to sell a home in Norwich County is around 40 days.  Inventories in Norwich traditionally run close to a balanced market of close to 6 months supply of homes offered for sale.  However, Buyers don’t tend to just look at Norwich County but consider the prices based on Oxford County averages which sit at 4 months’ supply.

Prices across Norwich County based on 21 sales in the first 3 months of 2019 are well above the average for the 12-month period ending December 31, 2018. The base of 21 homes is too low to have any real statistical value. The average price of these 21 sales is up $61,087 to $469,061. More important is the average for 12 months over 2018 reported at the end of last year at $407,974.

Summary:
Sales did slump everywhere across the County except Ingersoll, but this is following a stronger January and February, Weather may have been a player.  The future depends on the number homes offered for sale.  If we get to 6 months availability of homes offered for sale or higher price increases will slow. But, there is the introduction of the Canada Mortgage and Housing Corporation administration of the proposed “First Time Buyer Down Payment Support Program”, combined with Buyers coming into our area from the GTA, and continued aggressive immigration activity it is likely we will achieve our forecast of at least 5% to 8% for 2019.  We are above the 12-month average increase for 2018 so far this year.

Today is the lowest price that you will pay for a home in this area.  Prices always go up. The world recession and drop in 2008 was more than offset in 2009!  This is not Toronto or Vancouver. Our average prices are still the most affordable in Canada. Homes will never be more affordable.  Rent does not build equity, home ownership does. 

If you know someone who would benefit from our help, please tell them that you are passing along their contact information to us and we will take great care of them.  In closing once again this is not the time to downsize or cash out unless you must.

Gib& Mary Heggtveit
Broker and Sales Representative
Home Office 519-421-2626


Thursday 24 January 2019

Your Year End Oxford County Market Update for 2018


Oxford County-
Another outstanding year in price gains and it will continue above average in 2019.  The number of Homes sold dropped 17.9% over the record sales achieved in 2017. At the same time the number of homes offered for sale also fell keeping supply at an average of 4 months. The number of homes available in December jumped to 7 months. This is now dropping again below 6 months.


As you can see price increases held in December despite the higher inventories. For the year, prices rose +11.15% or $37,920. Bringing the value of the average home across Oxford County to $368,631.  Home owners got an average of 99.1% of their asking prices over the year and it took only an average of 38 days to be Listed, Available and Sold! This indicates that most home were involved in Bidding Wars. 

It is also interesting to look at demand by price point across our County.  The graph below indicates the number of Sales in 2018 by Price Range.
Most Buyers in our Area are shopping between $250,000 and $400,000. This segment is being driven by Buyers entering the market. The Move-Up Market, Resale Market (Toronto Buyers cashing out) is also significant, at about 60% of the New Buyers’ Market and is priced between $400,000 and $600,000.  A Psychological Barrier still exists for Homes prices over +$600,000. The number of Sales sit at about 30% of the $400,000 to $600,000 range.  As prices push up again this year between 5% to 8% again, this barrier may start to dissipate.

Once again TODAY is the best time to buy your first home or Move up! It is not the time to downsize or liquidate unless you must.  There are equity loans available for dealing with some of these issues. Talk to your bank or Mortgage Broker.  We are here to help any time.


Woodstock-
Woodstock is the driving force behind Oxford County accounting for 49.2% of the Sales of Residential Properties. The number of homes Sold across in Woodstock fell -23.3% for the year. 2018 started with sales off almost -40% for the first three months and then improved for the balance of the year.  The number of homes offered for sale consistently remained at about 4 months’ supply keeping upward pressure on prices.

Because of the limited number of homes offered for sale (6 months supply is a balanced market), Prices rose another whopping 11.1% or $36,845. Home owners received 99.1% of their asking price over the year. This once again indicated that bidding wars were happening with most properly priced homes.

Inventories were lower than the County coming into the new year.  This would continue to put upward pressure on prices in the months ahead.  As projected above for Oxford county the dynamics are similar.  We should see prices rising another 5% to 8% for 2019. Once again, we recommend Buying that First Home or Moving Up NOW! Don’t wait! You will be disappointed, and your equity position will erode.   Thinking of Downsizing or Liquidating?  WAIT! Don’t do it until the market moves back into a balanced market and price increases slow.  Call us Today…We are ready to help.

Ingersoll-
Sales fell in Ingersoll like the rest of Oxford County but at half the rate of Woodstock and the County. Sales fell only 12.6% for the 12 months ending December 31, 2018.  Inventories remained low at about only 3 months supply on average.  Inventories peaked in December jumping to 7 months’ supply following a slower November.  But, Sales in this area rebounded in December. The number of homes available in January 2019 is still below 4 months of Sales. It took only 23 days from Listing, Activation and Sale of the Average Home in December.
Buyers benefited in December from the November slow down. After 12 months the Average Home Price in Ingersoll rose a whopping 15.3%, or $44,136, achieving the highest increase for an Oxford County Community. The Average Home now sits above $300,000 for the first time at $333,435. The average price being the lowest in the area helped drive the higher values. Home Owners are consistently getting an average of 100% of asking price over the year.  This means continued Bidding Wars for the average home.

Ingersoll remains a great value area for Oxford County for First Time Buyers or Move Up Buyers. The rise in Prices in not over. This area will perform in line with the rest of the county attracting increases of 5% to 8% or possibly higher.

Norwich Township-
Sales in Norwich township fell only 10.3% during 2018. The number of months of supply of Homes offered for sale is the highest in the County but remained under 6 months of supply.  December 2018 did not record any firm Residential Sales in the Township, this creates a short-term increase to available properties going into the new year.
Prices rose 11.9% or $43,233 for the Calendar year 2018 across the Township, following the averages for Woodstock and the County. The average home now sits at $407,974 in the Township.

Once again, this area will follow the price increases anticipated for the County in general for 2019. We should realize increases between 5% to 8% over the calendar year. RIGHT NOW, is the best time to Buy that First Home or Move Up!

The recent RE/MAX National Market Forecast is making similar forecasts for London and Area, the Niagara Peninsula etc.  They are forecast a modest price decrease in Metro Toronto.  This will encourage continued relocation to our area.

Have Family, Friends or Co-Workers wanting to Buy or Sell? You know who to Call.  Let us put our 15 years of experience to work for them. Call us today! We will follow up and take great care of them.

Gib Heggtveit & Mary Heggtveit
Broker & Sales Representative
RE/MAX Centre City Realty Inc.

Direct:            519-421-2626
Gib Cell:         519-535-3975
Mary Cell:     519-535-7355

Email:            
gib @yourfavouriterealtors.com
mary@yourfavouriterealtors.com

Monday 15 October 2018


Your Oxford County  
Third Quarter 2018 Update
Our Trading Area:
The Real Estate Market is still “Hot” with prices rising and low inventories across our trading area.  Sales on a year-to-date basis are still below last year’s record of 28,831 sales for the area by -21.9%. We started 2018 with sales running 30% below 2017. That gap has narrowed by a stronger 3rd quarter.  The number of homes available for Sale rose to 5 months’ supply and fell to four months’ supply for the 3 months.  A balanced market is 6 months’ supply.  This is still very much a Sellers’ Market.

The average price of a Home in our trading area moved up the first 9 months of 2018 by a whopping 10.6% over the first nine months of 2017 and now sits at $366,025 for a home in our trading area. It was at $330,970 as of last September based on a rolling year average.

City of Woodstock:
The number of homes sold this year in the City of Woodstock itself are now only off -29.0%. Remember we started over 30% below last year’s record year. We’ve dropped back to traditional sales levels. We have explained previously that a balanced market (good supply and good demand) is 6 months supply.  We have been averaging 4 months’ supply for this year.  This lower number of Homes for Sale puts significant upward pressure on prices.  This year the City of Woodstock delivered Home Owners an average minimum of +99% of their list price. In In August and September Home Owners were getting above 98% of their asking prices. This is a quieter time of year but still very active. The number of days that it took to sell the average home in Woodstock moved between 37 and 34 days for July, August and September and now sits at 43 days
 
As you can see on the graph above, selling price of Homes in the City have risen nicely. Last year at this time the Average Selling Price of a Home in Woodstock reached $339,490. Home Owners will be pleased to know that this year the Average Selling Price is up above my projection and sits up 15.9% or $54,474 of the first 9 months of 2018.  September as you can see by the Graph above hit $400,000.

Buyers coming into or Living in Woodstock don’t like paying more than $600,000 for premium homes. The number of homes sold this year priced between $600K to $700K is about -60% lower than homes prices between $500K and 600K. Here is a graph that illustrated activity by price this year. Remember this is the top end of our market.


Ingersoll:
Sales in Ingersoll are now only down -22.4%, on a year to date basis over last year’s recordin line with the overall County results.
The number of Home sold in the last 4 months have surpassed the same four months of 2017. 3rd Quarter results and are up 58.7%.  Inventories are low, running at 3 months supply of homes for sale from June to now. It took 23 days to sell a home in September down from 28 days in August. What does all this mean? Well, its still very much a Seller’s Market based on demand and the number of homes coming to market that are offered for sale. Home Owners are consistently getting consistently getting 100% of asking price. 

 
As you can see by the graph above, Ingersoll selling prices have risen nicely.  The Average Home Selling Price last year reached $410,594 in North London. This year prices for the first 9 months have reached +11.9% or a gain of $34,723 for an average Home. The new Average Selling price in Ingersoll is now $326,654. One other interesting number to share with you. In the last three months average selling price has been above the average for the year, hitting as high as $416,104 based on the average of 20 Homes Sold in September.  Remember when Buying, or Selling, look at comparable homes.  Your decision to Sell, or to Buy, will be based on a realistic price. We must stress again, that we believe this upward price trend will continue but should slow next year to more normal annual increases. We recommend that Buyers “MOVING UP” or “FIRST TIME BUYER”. Do it right now! Sellers that want to “DOWNSIZE” Don’t Do It Now! You are throwing away equity, unless you must. Remember that there are always Equity Mortgage’s available…


Norwich:
The number of Homes Sold in Norwich Township though small in numbers have performed solidly on a year-to-date basis. The decline over last year’s record Sales of Homes is only -10.8% or 92 Homes Sold this year. The number of Home offered for sale now sits at 5 months’ supply of Homes for Sale, down from a Balanced Market in June and July at 6 Months’ supply.  The average days to sell, because of the slower time of year, has been running 59 days for July and August but did drop marginally to 55 days for September.   The average Home Owner in Norwich Township has experienced fewer competitive bid situations and are getting an average 98.2% of their asking price. What does all this mean?
 .
Sale prices for Homes in Norwich Township are now up 8.6% over the first 9 months of 2017. This represents an average increase in value and equity of $33,281. The average Home in Norwich Township now sells for $406,537 up from $373,256 in September last year, based again on nine months of sales of homes. As you can see things are still moving up! We must stress again that we believe this upward price trend will continue but should slow next year to more normal annual increases. We recommend that Buyers “MOVING UP” or “FIRST TIME BUYER”. Do it right now! Sellers that want to “DOWNSIZE” Don’t Do It Now! You are throwing away equity, unless you must. Remember that there are always Equity Mortgage’s available…
.
If we are running close to last year’s sales of homes now, we should Buy and Sell close to 25 homes between October and December.  Based on the price trends in the last few months we will see additional price gains.


If you are thinking of liquidating or downsizing, “DON’T DO IT NOW “, unless you have to.

Summary:
We are here to “Help”, You, Your Family, Your Neighbours, Your Co-Workers and Your Friends!  Any time to Buy or Sell, is a good time in this “Hot Market”!   Why?  If you are paying rent the Housing Market is leaving you behind.  Any home ownership is keeping pace for your ability to move up as you build equity too.  It is also a good time to move up, let’s say the difference is value of your Home to the Home you want to Buy is $75,000.  Doing it now, may put $5000 to $7500 future equity in your pocket, if the Market moves anther 6% to 10 %.  This is not a time to procrastinate. An average of 10.2 Homes sell every month across Norwich Township in 2018.

If we are running close to last year’s sales of homes now, we should Buy and Sell close to 25 homes between October and December.  Based on the price trends in the last few months we will see additional price gains.CALL TODAY:


Gib Heggtviet                        Mary Heggtveit
Real Estate Broker               Sales Representative
Direct: 519-535-3975            Direct: 519-535-7355


Prices Don’t stay Down EVER!  Look below at the average prices for 2008 when World recession hit and 2009 when we started recovery in back half.


Don’t “Wish You Did”
Call Now: 
519-421-2626